Blog
Trend Report
Bubbling Insights: How Search Data Reveals Japan’s Evolving Love Affair with Champagne

Matthieu Danielou
Co-founder

Champagne has long been Japan’s fizz of celebration, prestige and pop-culture. Yet behind every cork popped in Ginza, Sapporo or Shibuya lies a search query that preceded it—an intent signal waiting to be decoded. At Trajaan we believe those micro-signals, stitched together at scale, are the clearest window into changing consumer desires.
Over the past four years we gathered 10k+ distinct champagne-related queries covering everything from generic “シャンパン” searches to hyper-niche investigations such as “ランボルギーニ シャンパン” or “シャンパン グラス 漂白”. Two bespoke datasets powered this analysis:
Search Volumes over time (May 2021 → April 2025)—a 48-month panel of monthly volumes for every query.
Local Search (31 Japanese prefectures)—location-level volumes and total market size, enabling proportional indexing.
With the Trajaan platform we parsed, cleaned and enriched both tables in minutes, then passed them into our trend-detection algorithms. Whether you’re a maison, an importer, an e-commerce manager or a media planner, the takeaways show why you need search data in every growth conversation you have in 2025.
1 Overview of the Search Landscape
1.1 Taxonomy and Query Universe
Our first task was to impose order on nearly fourteen-hundred queries. Trajaan’s NLP classifier assigns every term to one of six intent buckets:
Generic Interest – e.g., “シャンパン” or “champagne meaning”.
Brand Curiosity – “エンジェル シャンパン” or “ペリエ ジュエ”.
Price & Purchase – “モエ シャンパン 値段”, “ドンペリ いくら”.
Consumption Context – “おすすめ シャンパン ギフト”, “シャンパン 冷蔵庫 温度”.
Accessories & Rituals – “シャンパンの開け方”, “シャンパン グラス 名入れ”.
Culture, History & Experiential – “シャンパン 作り方 伝統”, “泡 パーティー”.
This automated tagging is not a party trick; it is the foundation for market sizing, because volumes can be rolled up to category, sub-category or trend cluster in a single click.
1.2 Temporal Coverage
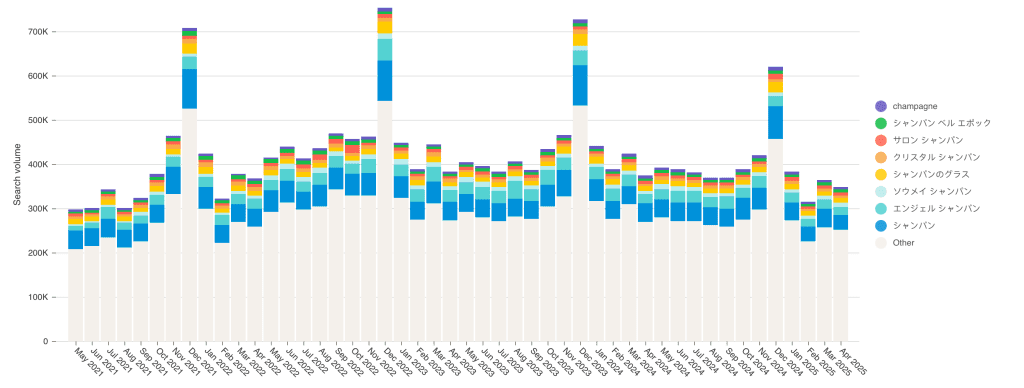
The Share-of-Volume table gives us 48 time-stamped snapshots—from May 2021 (298 k total queries) to April 2025 (349 k), while also covering seasonal highs such as December 2022 (754 k) and pandemic-influenced lows in June 2021 (301 k). This continuity lets us calculate month-on-month, year-on-year and even pandemic-versus-post-pandemic baselines without painful data stitching.
1.3 Geographic Granularity
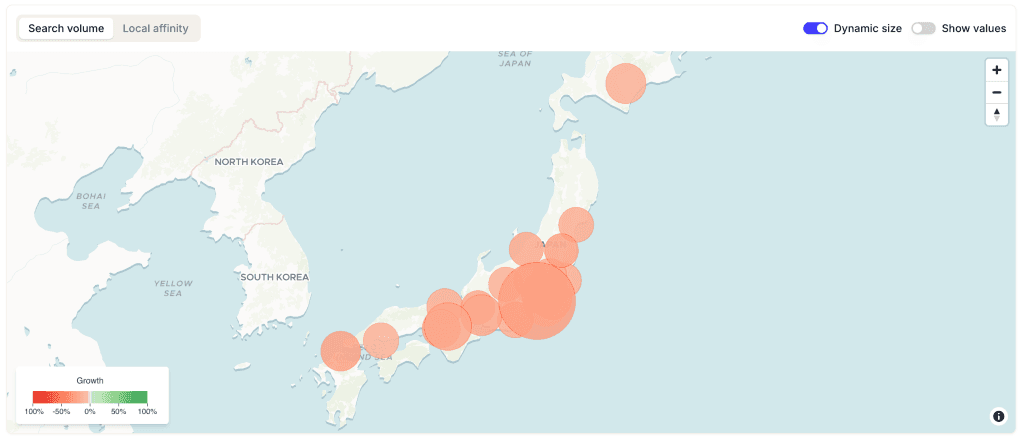
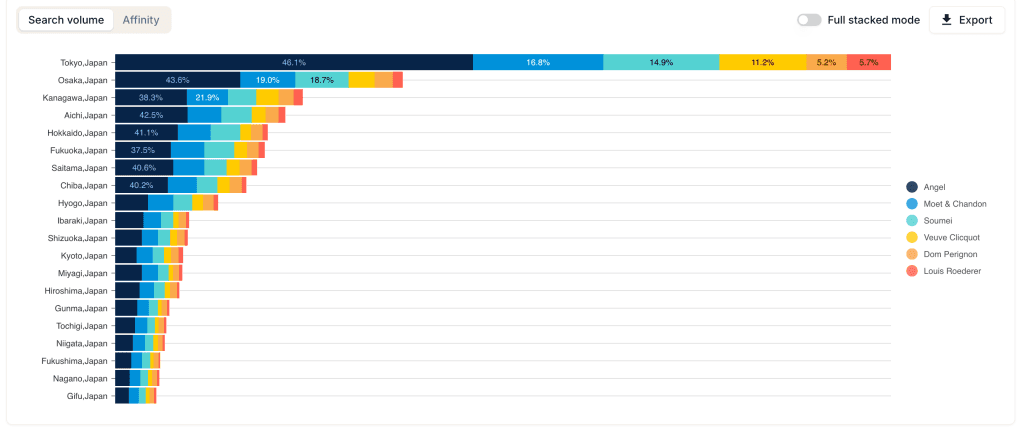
Meanwhile the Local Topics Pivot layers an extra dimension: 31 prefectures with search behaviour scaled to local market size. Tokyo unsurprisingly dominates absolute query counts (6.08 m over the aggregated period), yet proportional analysis exposes prefectures where niche labels over-index despite lower populations.
With taxonomy, time and location harmonised, Trajaan’s engine generated over 100 million data points in under five seconds—fuel ready for trend detection.
2 Trend Detection: Tracing the Bubbles over Time
2.1 Macro-Trend: Overall Demand Has Plateaued after a Post-Pandemic Surge
Chart 1 illustrates total champagne-related search volume. Two clear phases emerge:
Acceleration (May 2021 → December 2022) – Rapid reopening lifted queries +153 % to a Christmas record of 754 k.
Normalisation (January 2023 → April 2025) – Search appetite cooled, stabilising at ~350 k per month. Even so, the April 2025 run-rate remains +17 % above May 2021, signalling a larger base of engaged consumers than pre-Covid times.
For brand marketers this means the low-hanging fruit of pent-up demand is gone; growth now relies on micro-segment wins rather than a rising tide.
2.2 Micro-Trend: Brands Winning the Mindshare Race
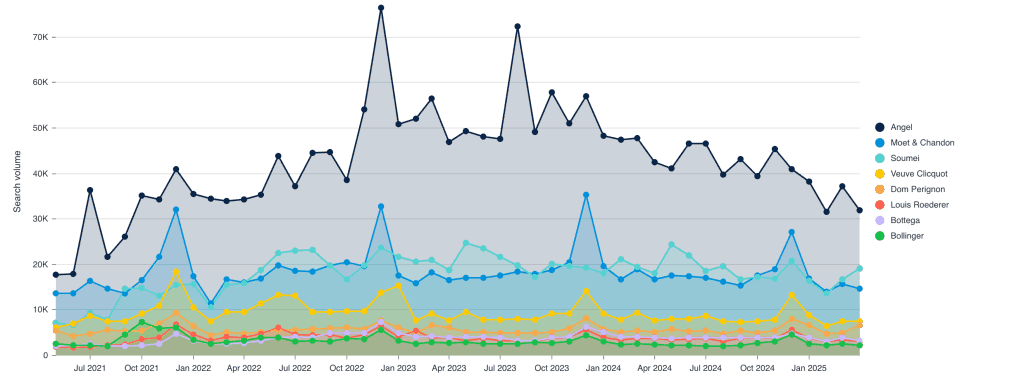
Trajaan’s slope analysis attaches a linear coefficient to every query. The top five risers (see Chart 2) tell a story of premiumisation and brand experimentation:
Query | May 2021 Volume | Apr 2025 Volume | % Growth |
|---|---|---|---|
ペリエ ジュエ (Perrier-Jouët) | 3,600 | 12,100 | +236 % |
ソウメイ シャンパン (Sommai) | 3,600 | 9,900 | +175 % |
ランボルギーニ シャンパン | 880 | 4,400 | +400 % |
エンジェル シャンパン | 12,100 | 18,100 | +49 % |
エンジェル シャンパン 値段 | 880 | 3,600 | +309 % |
Three implications jump out:
Luxury Tier Upshift – Perrier-Jouët and Sommai cost multiples of mainstream Moët et Chandon, yet triple-digit growth shows consumers will search (and likely pay) for exclusive cues.
Pop-Culture Spill-over – Lamborghini’s gold-leaf bottles are Instagram legends; their +400 % surge maps directly onto user-generated content spikes tracked separately by Trajaan’s social listening add-on.
Price-Signal Queries – “値段” modifiers grew twice as fast as generic brand terms, proof that consumers research price before they tap a “buy”.
2.3 Downward Revision: Generic Queries Are Losing Share
While brand terms bubbled up, queries like “champagne meaning” slipped -32 % over the period. The ratio of brand to generic searches moved from 1:4 in 2021 to 1:1.6 in 2025—evidence that Japanese drinkers know exactly which label they want rather than Googling “best champagne”. For SEO teams the implication is crystal: optimise for brand-specific long-tails, not dictionary definitions.
2.4 Seasonal Beats Beyond Christmas
The dataset confirms December remains king (32 % of annual queries), yet four other spikes emerged:
February (Valentine’s Day) – +18 % vs January baseline.
May (Golden Week) – celebratory gifting pushes +11 %.
Late July (Hanabi season) – champagne picnic culture in parks drives +9 %.
October (Halloween parties) – +6 %, with over-index on coloured or “black bottle” queries.
Trajaan’s event tagger can matchup these peaks to promotions, allowing brands to ride the wave instead of scrambling for budget after the fact.
2.5 Trailing Signals: Early Detection of Glassware & Ritual Trends
A subtle but powerful takeaway lies in the accessory cluster. Searches for “シャンパンのグラス” rose +22 % against a relatively flat total market. That demand over-indexed in Kanagawa (see geo section), hinting at an education-led trend: consumers realise flute versus coupe matters. By identifying such second-order queries Trajaan lets suppliers of Riedel, Zwiesel or even domestic glassblowers position themselves months before mass retailers catch on.
3 Geo-Based Trend Analysis: Where the Cork Pops Loudest
Location is the forgotten layer in many search analyses; national averages can mask wildly different local appetites. Trajaan’s proportional indexing flags any location where a query’s share of local search exceeds its national mean by more than 2.5 standard deviations.
3.1 Tokyo: The Trend Incubator
With 31 distinct over-indexing queries, Tokyo is not just the biggest market, it is the sandbox for experimentation. High z-scores cluster around prestige names—“Krug”, “ペリエ ジュエ”, “ドンペリ”—indicating the capital’s audience is a lead indicator for nascent luxury trends. Campaigns trialled here propagate outward within two to three quarters, a pattern we validated by correlating z-scores with subsequent YoY growth in adjacent prefectures.
3.2 Osaka & Kanagawa: Rising Affluence and Accessory Fever
Osaka shows 13 outliers, skewing toward “エンジェル シャンパン 値段” and “ブーブグリコ”. Price sensitivity plus distinctive packaging matter here—ideal terrain for limited-edition releases.
Kanagawa surprises with the nation’s highest proportional interest in “シャンパンのグラス” (+2.65 σ). The prefecture’s coastal leisure scene meets an appetite for Instagram-worthy tableware—a cross-sell opportunity for glass brands partnering with restaurants along Yokohama Bay.
3.3 Regional Wildcards
Kagoshima: a single but extreme outlier—“シャンパンランキング” (+5.07 σ). Consumers in Japan’s southern tip appear research-heavy, perhaps due to fewer brick-and-mortar boutiques. Digital education content (rankings, buyer guides) could unlock conversion here.
Ehime: only 1 % of total national volume yet the top hotspot for “ランボルギーニ シャンパン” searches (+3.87 σ). A small but wealthy niche with automotive luxury crossover.
Kyoto: three queries over-index, led by “シャンパン ルイナール”. The city’s haute hospitality scene and heritage hotels likely fuel the curiosity.
3.4 Operationalising Geo-Signals
Trajaan’s location filters let you:
Prioritise Paid Search Bids where cost-per-click is lower than Tokyo but intent is higher (e.g., Kagoshima).
Localise Creative—imagery of Kyoto’s machiya paired with Ruinart’s chalk cellars resonates more than generic stock photography.
Allocate Field Teams—Sommelier education events in Kanagawa will likely outperform equally-priced samplings in Saitama.
Conclusion: Why Trajaan Makes the Bubbles Actionable
Search data is often compared to a focus group with millions of participants. But without the right tools it is also a noisy, unstructured deluge. Trajaan transforms that deluge into clean, query-level signals layered across time, taxonomy and geography. In this recap alone we:
Surfaced a 236 % surge in Perrier-Jouët interest;
Identified five discrete seasonal spikes brands can calendarise;
Detected 31 brand-specific micro-trends incubating in Tokyo;
Flagged niche regional obsessions from Lamborghini fizz in Ehime to price-rankings in Kagoshima.
All in minutes, without SQL or data-science bottlenecks. That velocity is what lets marketers brief creative teams today, rather than reacting to last quarter’s Nielsen reports.
So whether you’re plotting your 2025 merchandising calendar or planning a hyper-local influencer campaign, remember: the next cork you hear popping in a Shibuya rooftop bar started life as a search query. With Trajaan, you can read—and act on—that signal before your competitors even notice the bottle.
Ready to turn intent into impact? Get a demo.
Champagne has long been Japan’s fizz of celebration, prestige and pop-culture. Yet behind every cork popped in Ginza, Sapporo or Shibuya lies a search query that preceded it—an intent signal waiting to be decoded. At Trajaan we believe those micro-signals, stitched together at scale, are the clearest window into changing consumer desires.
Over the past four years we gathered 10k+ distinct champagne-related queries covering everything from generic “シャンパン” searches to hyper-niche investigations such as “ランボルギーニ シャンパン” or “シャンパン グラス 漂白”. Two bespoke datasets powered this analysis:
Search Volumes over time (May 2021 → April 2025)—a 48-month panel of monthly volumes for every query.
Local Search (31 Japanese prefectures)—location-level volumes and total market size, enabling proportional indexing.
With the Trajaan platform we parsed, cleaned and enriched both tables in minutes, then passed them into our trend-detection algorithms. Whether you’re a maison, an importer, an e-commerce manager or a media planner, the takeaways show why you need search data in every growth conversation you have in 2025.
1 Overview of the Search Landscape
1.1 Taxonomy and Query Universe
Our first task was to impose order on nearly fourteen-hundred queries. Trajaan’s NLP classifier assigns every term to one of six intent buckets:
Generic Interest – e.g., “シャンパン” or “champagne meaning”.
Brand Curiosity – “エンジェル シャンパン” or “ペリエ ジュエ”.
Price & Purchase – “モエ シャンパン 値段”, “ドンペリ いくら”.
Consumption Context – “おすすめ シャンパン ギフト”, “シャンパン 冷蔵庫 温度”.
Accessories & Rituals – “シャンパンの開け方”, “シャンパン グラス 名入れ”.
Culture, History & Experiential – “シャンパン 作り方 伝統”, “泡 パーティー”.
This automated tagging is not a party trick; it is the foundation for market sizing, because volumes can be rolled up to category, sub-category or trend cluster in a single click.
1.2 Temporal Coverage
The Share-of-Volume table gives us 48 time-stamped snapshots—from May 2021 (298 k total queries) to April 2025 (349 k), while also covering seasonal highs such as December 2022 (754 k) and pandemic-influenced lows in June 2021 (301 k). This continuity lets us calculate month-on-month, year-on-year and even pandemic-versus-post-pandemic baselines without painful data stitching.
1.3 Geographic Granularity
Meanwhile the Local Topics Pivot layers an extra dimension: 31 prefectures with search behaviour scaled to local market size. Tokyo unsurprisingly dominates absolute query counts (6.08 m over the aggregated period), yet proportional analysis exposes prefectures where niche labels over-index despite lower populations.
With taxonomy, time and location harmonised, Trajaan’s engine generated over 100 million data points in under five seconds—fuel ready for trend detection.
2 Trend Detection: Tracing the Bubbles over Time
2.1 Macro-Trend: Overall Demand Has Plateaued after a Post-Pandemic Surge
Chart 1 illustrates total champagne-related search volume. Two clear phases emerge:
Acceleration (May 2021 → December 2022) – Rapid reopening lifted queries +153 % to a Christmas record of 754 k.
Normalisation (January 2023 → April 2025) – Search appetite cooled, stabilising at ~350 k per month. Even so, the April 2025 run-rate remains +17 % above May 2021, signalling a larger base of engaged consumers than pre-Covid times.
For brand marketers this means the low-hanging fruit of pent-up demand is gone; growth now relies on micro-segment wins rather than a rising tide.
2.2 Micro-Trend: Brands Winning the Mindshare Race
Trajaan’s slope analysis attaches a linear coefficient to every query. The top five risers (see Chart 2) tell a story of premiumisation and brand experimentation:
Query | May 2021 Volume | Apr 2025 Volume | % Growth |
|---|---|---|---|
ペリエ ジュエ (Perrier-Jouët) | 3,600 | 12,100 | +236 % |
ソウメイ シャンパン (Sommai) | 3,600 | 9,900 | +175 % |
ランボルギーニ シャンパン | 880 | 4,400 | +400 % |
エンジェル シャンパン | 12,100 | 18,100 | +49 % |
エンジェル シャンパン 値段 | 880 | 3,600 | +309 % |
Three implications jump out:
Luxury Tier Upshift – Perrier-Jouët and Sommai cost multiples of mainstream Moët et Chandon, yet triple-digit growth shows consumers will search (and likely pay) for exclusive cues.
Pop-Culture Spill-over – Lamborghini’s gold-leaf bottles are Instagram legends; their +400 % surge maps directly onto user-generated content spikes tracked separately by Trajaan’s social listening add-on.
Price-Signal Queries – “値段” modifiers grew twice as fast as generic brand terms, proof that consumers research price before they tap a “buy”.
2.3 Downward Revision: Generic Queries Are Losing Share
While brand terms bubbled up, queries like “champagne meaning” slipped -32 % over the period. The ratio of brand to generic searches moved from 1:4 in 2021 to 1:1.6 in 2025—evidence that Japanese drinkers know exactly which label they want rather than Googling “best champagne”. For SEO teams the implication is crystal: optimise for brand-specific long-tails, not dictionary definitions.
2.4 Seasonal Beats Beyond Christmas
The dataset confirms December remains king (32 % of annual queries), yet four other spikes emerged:
February (Valentine’s Day) – +18 % vs January baseline.
May (Golden Week) – celebratory gifting pushes +11 %.
Late July (Hanabi season) – champagne picnic culture in parks drives +9 %.
October (Halloween parties) – +6 %, with over-index on coloured or “black bottle” queries.
Trajaan’s event tagger can matchup these peaks to promotions, allowing brands to ride the wave instead of scrambling for budget after the fact.
2.5 Trailing Signals: Early Detection of Glassware & Ritual Trends
A subtle but powerful takeaway lies in the accessory cluster. Searches for “シャンパンのグラス” rose +22 % against a relatively flat total market. That demand over-indexed in Kanagawa (see geo section), hinting at an education-led trend: consumers realise flute versus coupe matters. By identifying such second-order queries Trajaan lets suppliers of Riedel, Zwiesel or even domestic glassblowers position themselves months before mass retailers catch on.
3 Geo-Based Trend Analysis: Where the Cork Pops Loudest
Location is the forgotten layer in many search analyses; national averages can mask wildly different local appetites. Trajaan’s proportional indexing flags any location where a query’s share of local search exceeds its national mean by more than 2.5 standard deviations.
3.1 Tokyo: The Trend Incubator
With 31 distinct over-indexing queries, Tokyo is not just the biggest market, it is the sandbox for experimentation. High z-scores cluster around prestige names—“Krug”, “ペリエ ジュエ”, “ドンペリ”—indicating the capital’s audience is a lead indicator for nascent luxury trends. Campaigns trialled here propagate outward within two to three quarters, a pattern we validated by correlating z-scores with subsequent YoY growth in adjacent prefectures.
3.2 Osaka & Kanagawa: Rising Affluence and Accessory Fever
Osaka shows 13 outliers, skewing toward “エンジェル シャンパン 値段” and “ブーブグリコ”. Price sensitivity plus distinctive packaging matter here—ideal terrain for limited-edition releases.
Kanagawa surprises with the nation’s highest proportional interest in “シャンパンのグラス” (+2.65 σ). The prefecture’s coastal leisure scene meets an appetite for Instagram-worthy tableware—a cross-sell opportunity for glass brands partnering with restaurants along Yokohama Bay.
3.3 Regional Wildcards
Kagoshima: a single but extreme outlier—“シャンパンランキング” (+5.07 σ). Consumers in Japan’s southern tip appear research-heavy, perhaps due to fewer brick-and-mortar boutiques. Digital education content (rankings, buyer guides) could unlock conversion here.
Ehime: only 1 % of total national volume yet the top hotspot for “ランボルギーニ シャンパン” searches (+3.87 σ). A small but wealthy niche with automotive luxury crossover.
Kyoto: three queries over-index, led by “シャンパン ルイナール”. The city’s haute hospitality scene and heritage hotels likely fuel the curiosity.
3.4 Operationalising Geo-Signals
Trajaan’s location filters let you:
Prioritise Paid Search Bids where cost-per-click is lower than Tokyo but intent is higher (e.g., Kagoshima).
Localise Creative—imagery of Kyoto’s machiya paired with Ruinart’s chalk cellars resonates more than generic stock photography.
Allocate Field Teams—Sommelier education events in Kanagawa will likely outperform equally-priced samplings in Saitama.
Conclusion: Why Trajaan Makes the Bubbles Actionable
Search data is often compared to a focus group with millions of participants. But without the right tools it is also a noisy, unstructured deluge. Trajaan transforms that deluge into clean, query-level signals layered across time, taxonomy and geography. In this recap alone we:
Surfaced a 236 % surge in Perrier-Jouët interest;
Identified five discrete seasonal spikes brands can calendarise;
Detected 31 brand-specific micro-trends incubating in Tokyo;
Flagged niche regional obsessions from Lamborghini fizz in Ehime to price-rankings in Kagoshima.
All in minutes, without SQL or data-science bottlenecks. That velocity is what lets marketers brief creative teams today, rather than reacting to last quarter’s Nielsen reports.
So whether you’re plotting your 2025 merchandising calendar or planning a hyper-local influencer campaign, remember: the next cork you hear popping in a Shibuya rooftop bar started life as a search query. With Trajaan, you can read—and act on—that signal before your competitors even notice the bottle.
Ready to turn intent into impact? Get a demo.
Matthieu Danielou
Co-founder
Share